
Sadistically Statistical
Safety Stock
In our last article, we examined the simple forms of safety stock calculations. For many small shops these work. If the operation does not track demand (sales) and other factors, like the actual lead time in a disciplined periodic schedule (daily or hourly), then the methods we covered previously will work most of the time.
Why do I say most of the time? Well, that is because of the real purpose of safety stock. Safety stock is not meant to eliminate stock outs, only to reduce the likelihood of them happening. Think of safety stock as insurance — it does not prevent the accident; it only provides some recovery protection. Even with safety stock, things can happen that spike demand or drop supply until there is not enough inventory on hand to fulfill the demand.
Let’s repeat: even with safety stock, there will be times when there is not enough inventory on hand to fulfill the demand.
Absolutes Are Abstractions
I often say that in the physical world there are no absolutes. There is no such condition as a perfect vacuum. There is no place on Earth where life does not exist; in some places it is just so small we can’t see it. Perfection is a human abstraction. You can get close to perfection, but you can never reach it. Only God is perfect.
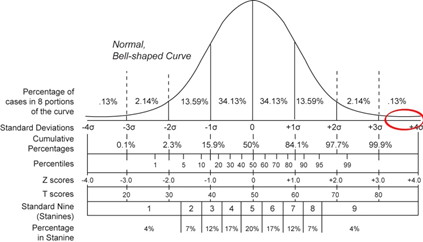
Statistics relies on the notion that there are infinite possibilities, even if many of those infinite possibilities are highly improbable. Notice the red circle on the normal bell-shaped curve to the left. Most depictions of this curve show the edges ending on the base line. In statistics, however, the curve flattens out until it is almost parallel to the base line, running out to infinity in both directions. Sure, you can test 1,000 pieces of ASTM A36 steel for tensile strength, each one breaking around 600 MPa (Mega Pascals). But not all of them break at 600 MPa; some break at a low of 396MPa and some at a high of 804 MPa. Then there is the one that held on up to 1,000 MPa. It was the outlier, the one that lives somewhere in that red circle of the curve.
The performance of any material or natural function falls into the normal distribution. Statistics assumes that with a large enough population, the variable you are measuring will eventually look like the normal distribution curve. That is why I sometimes refer to sadistically statistical results. The closer you get to reaching an absolute, the harder and more painful the effort becomes.
Thus, it will never be possible to always have an item in stock. And the harder we try to stay in stock, the more energy and money we must spend to ensure that it does not happen.
The Sadistic Statistics of Service Level
Inventory managers use servicelLevel as a measure of how often they are willing to be out of stock. While it can be a measure, it is really an abstract setting in a formula. I say setting because it is hard to measure service level accurately without a large enough data sample. Service level is the probability that an item will be in stock when a customer demands it. A 95% service level is a 95% probability that the item the customer wants will be in stock when the customer wants it.
Probability is just a guide, not an absolute. A 95% service level does not mean that five out of every 100 customers are not going to be able to get the item; it just means there is a 5% chance any given customer will not. Probability is a gamble.
This is where the sadistically statistical part of service levels and probability comes into focus. If the only action we can take to ensure a high in-stock probability is to build more just-in-case inventory, at some point we will run out of working capital to run the store.
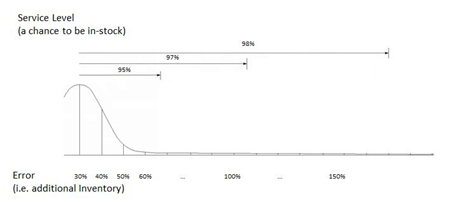
Consider this chart. In the example, to ensure a 95% service level (probability of being in stock), we need to carry almost 70% more inventory than average demand dictates. Increase the service level by just two points, from 95% to 97%, and we have to carry twice as much as our average demand requires. Now add just one more point to the service level, moving the lever to 98%. We now have to stock 170% of the average!
The Z Score
In the statistical formulas for calculating safety stock, the very first factor is the Z score. The Z score, also known as the standard score, is like a steroid to any of the statistical safety stock formulas. The Z score can quickly hop up the safety stock, and in some cases create a safety stock that is double or triple the average inventory needed to meet average demand.
Let’s again consider the normal distribution, the bell-shaped curve. In a perfect world, we should not have to meet any more than an average demand, which is the peak of the curve. With a rock steady demand — say 20 units per day — and a weekly replenishment on Monday that is never late, we only need to have 140 units in stock on Monday.
Except we don’t live in a perfect world. Everything varies. Demand for the product changes. If we stock only 140 units, about half the time we will run out of stock by the end of the week, before we get our next delivery.
Each of the safety stock formulas will add more inventory to bring the probability of being out of stock at the end of the week to 84.1%, the first standard deviation. If we just do the formula we get an 84% service level.
Now assume we want a 95% service level. Follow the percentiles line in the chart above and look at the Z score under it. Eyeballing the value between +1.0 and +2.0, it looks like we would multiply the safety stock by an additional 1.6 – 160%. Now crank the service level up to 97% and you start to carry twice the safety stock.
Service Level is the Safety Stock Steroid
Depending on the variability in the supply chain, the basic form of any of the four statistical safety stock formulas will increase the inventory carried. Increase demand variability, lead-time variability, or both, and the safety stock increases. For wide swings, the safety stock alone can be equal to or greater than average inventory level. Add in a heavy dose of service factor, and the safety stock can quickly become multiples of the average inventory.
Steroids bulk up an athlete’s muscles, making them stronger. But the same steroid can do great damage to the athlete’s body, damaging the quality of their life. Too much of the “juice,” and bad things happen. The same goes for the service levels. Too much can really bulk up the inventory in a bad way.
Articles in This Series


Call Us! 877-674-7495 info@dksco1.com