
Multiple Statistical Safety Stock Methods
There are four statistical methods for calculating safety stock. Each fits a specific application niche, depending on the conditions of the inventory in question.
- Lead time never changes and demand changes.
- Demand never changes and the lead time changes.
- Lead time and the demand changes, and are independent.
- Demand changes depend on lead time changes.
Confused? Some folks are. In preparation for this series, I researched a plethora of articles about calculations, in order to see what people are using. Back in the Dark Ages, before programmable calculators and personal computers, I learned the four different methods. Each method is for a specific application. Each method requires a different amount of work, which was not a trivial matter in the days of hand calculation. Finally, each method yields a different answer.
 That last line is important: each method yields a different answer. For those readers who have been reading our articles for a few years, the image above should be a familiar reminder that one size does not fit all. It recalls an old garment industry joke. You’ve heard the expression, “One Size Fits All”? The joke is that this statement is true only of the Mumu — the housedress. Yes, it fits everybody, but not quite in the same style, and not as well as other garments.
The same goes for statistical safety stock calculations. Each method is for a specific application. It is the user’s responsibility to understand the dynamics of their inventory process, and the user’s responsibility to choose the right formula. So how do you choose?
Here is Our Rosetta Stone for Statistical Safety Stock Calculations
 Unlike all those textbooks that use symbols as though you were in an 11th-grade calculus class, I like to spell things out and show examples. The following examples do not include the service level steroid injection, just to ensure that the differences between the models and the results are clear. Each example uses the same variables, so we can clearly see how the results change with the formulas.
We use plugged variables in these examples, but in practice, you should have an ongoing database to track the daily demand, and a record of the actual lead time for each order of goods. Without that data, you don’t have the raw materials you need for the statistical models to work accurately.
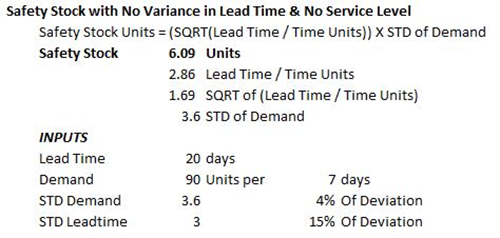
First Method: Lead time never changes and Demand changes
The Formula
Safety Stock Units =
(Square Root of (Lead Time/Time Units)) X Standard Deviation of Demand
The Example
Working the Formula:
- Divide the Lead Time by the Time Units, in this case 8/7
- Calculate the Square Root of Step 1, in this case the Square Root of 8/7
- Multiply the Result of Step 2 by the Standard Deviation of Demand: 1.069 X 10
Example for Use:
Imagine a coal-fired power plant that is located next to the coal mine. The coal comes out of the mine in a steady stream, twenty-four hours a day, seven days a week. Or in these days of global warming fears, imagine that the power plant uses natural gas, and the gas flows 24/7. In both examples, the variance in demand across the seasons requires some stock on hand to address the variable changes in demand, more in summer than winter.
Sometimes this is the formula used to calculate the safety stock of manufactured finished goods in a factory. Companies that run production of a process material used by other manufacturers (like the production of whey products for the food industry) also use this formula. Normally, planners work with a known production time, and most ERP/MRP systems will order components and raw materials based on set lead times in the system. If demand rises, the planners move production up in the schedule; if it falls, they move production back, converting the lead time into what is called safety time.
If lead time is consistent and demand moves and dances, this is the formula to use.
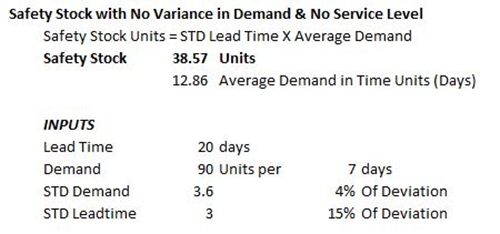
Second Method: Demand Never Changes but Lead Time Does
The Formula
Safety Stock Units =
Standard Deviation of Lead Time X Average Demand
The Example
Working the Formula:
- Calculate the Standard Deviation of Lead Time
- Multiply the Result of Step 2 by the Average Demand in Days
Example for Use:
Imagine a school cafeteria; the item in demand is milk. Unless it is a holiday, every lunch is going to have a half pint of milk. Look at the wholesale dairy that delivers milk to all the elementary schools in an area. Demand from that particular cafeteria is going to be rock steady, but supply lead time may not be, depending on other customers’ demands for milk.
Oil refining uses this formula, as do some other process industries like steel making. These processes must keep going because it is very costly to stop and restart a blast furnace or a refining tower once it has been started. So the production planners have to maintain a safety stock to keep the process flowing if there are delays in lead time. A refinery supplied by a crude oil pipeline may not need as much safety stock as a refinery dependent on delivery by tankers or trains, but they still need safety stock held in the crude terminals that feed the distillation towers. In these production systems, the demand itself is the process that requires a constant supply of crude, or coke and iron ore, to survive.
If your demand is consistent, never wavering while lead time changes, this is the formula to use.
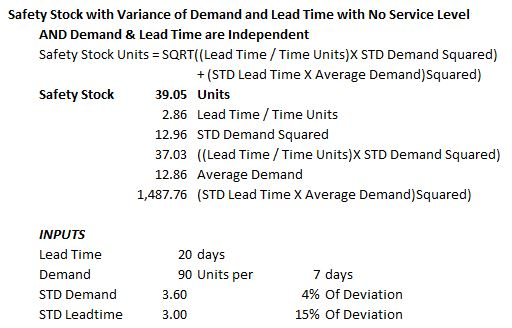
Third Method: Lead Time and Demand are Independent Variables
The Formula
Safety Stock Units =
Square Root of ((Lead Time / Time Units) X Standard Deviation Demand Squared) + (The Square of (Standard Deviation of Lead Time X Average Demand))
The Example
Working the Formula:
- Divide the Lead Time by the Time Units — in this case 8/7
- Calculate the Standard Deviation of Lead Time and Square it
- Multiply the Results of Steps 1 and 2
- Calculate the Square Root of the Result of Step 3
- Calculate the Standard Deviation of Lead Time
- Multiply the Result of Step 5 by the Average Demand in Days
- Add the Results of Steps 4 and 6
Example for Use:
This is the universal application for any retail or wholesale environment. Changes in lead time are independent of changes in demand, unless the total demand of a product in the market is far greater than the supply. Changes in demand are independent of the lead time, unless there is an interruption in supply for the total market.
At times, make-to-order manufacturers use this formula to plan safety stock of components used across a wide product line — for example, the safety stock for macaroni elbows and shapes used by a soup company that makes multiple soups containing the same ingredient.
If your demand and lead time changes for independent reasons, this is the formula to use.
Fourth Method: Demand Changes Depend on Lead Time Changes
The Formula
Safety Stock Units =
((Square Root of the (Lead Time / Time Units)) X Standard Deviation of Demand)
+ (Standard Deviation of Lead Time X Average Demand)
The Example
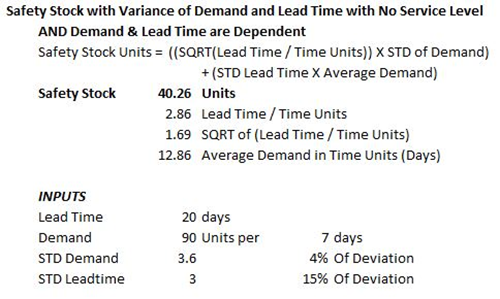
Working the Formula:
- Divide the Lead Time by the Time Units — in this case 8/7
- Calculate the Square Root of the Result of Step 1
- Calculate the Standard Deviation of Demand
- Multiply the Results of Steps 1 and 3
- Calculate the Standard Deviation of Lead Time
- Multiply the Result of Step 5 by the Average Demand in Days
- Add the Results of Steps 4 and 6
Example for Use:
This is the formula to use when market demand is greater than market supply. Apparel manufacturers, wholesalers, and retailers use this formula for fashion items that follow trends. This method models how much safety stock is needed to keep up with the growing demand.
Articles in This Series


Call Us! 877-674-7495 info@dksco1.com