
Why Not IT?
My client asked me to describe the team of people I would select for a big data project. There was only one IT person on the project. When I was done, I dropped the other shoe.
 “The team should report to the CEO, not the CIO.”
I know that flies in the face of what you will see if you go looking on the internet. There is a reason for my opinion. CIOs who possess the vision to know what the company needs are as rare as purple squirrels. Admittedly, that statement is based on my observations, not on empirical evidence.
Cream rises to the top. The best CIOs are right there with the CEO, participating in the effort to create vision. However, there can only be so many best players. Applying the cream to milk ratio of 1 pint per gallon (1:16, or 6.25%), only 6 percent of companies have a top-shelf CIO. While I am sure that Amazon, HP, Dell, ExxonMobil, and the like have superior CIOs working for them, there are a whole lot more companies that just do not have that kind of talent.
Still, even with an above-average CIO, you have to wonder who is advising the CIO? Using another broad brush to paint the picture, consider a behavior that appears in many enterprises. Where do executives learn about their own area of specialization? They go to school, and work their way up the silo of their profession. They may jump companies on their way up, either jumping to a better gig or landing somewhere after exfoliation from their last job.
There is the fairy tale about really great companies that rotate executives through different divisions, different tasks, and different roles in order for them to learn about other parts of the company. We hear that story about the CEOs of companies like Xerox, GE, and other huge global corporations. We also hear the same story on the opposite end of the company-size spectrum, the family-owned SMB where the younger generation worked in the warehouse, drove a truck, or made sales calls as they grew up and went to college, and they are now in line to assume the mantle of the family legacy. Still, when we hear these stories we must keep the cream to milk ratio of 1:16 in mind. I think the frequency with which the story is told is much greater than the actual number of cases.
Do I sound cynical? Yup. Guilty as charged.
My CEO client challenged my cynicism. I rose to the occasion.
“Why am I sitting here with you?”
The room got quiet.
I was there because the CEO asked me to talk to him about big data. The confusing conversations the CEO had been having with the guy who served as the CIO had started the whole process.
“OK, so the team reports to me,” said my client. “What is next?”
Choosing the Right Data
The team must decide what data to use. They go on a journey of discovery to find it.
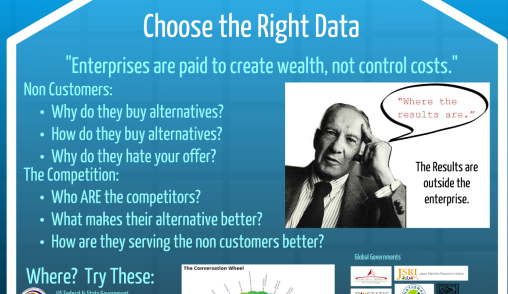
Drucker teaches us that enterprises create wealth. You don’t create wealth by controlling costs; you merely preserve it. Without revenue, the oxygen of business, you are not creating wealth, so the costs do not matter.
Again, Drucker reminds us that the results are outside the box of the company, therefore the team must go find external data to work with, not internal data. The team starts their journey of discovery by asking questions about non-customers and competitors.
- ⦁ What alternatives do non-customers choose?
- ⦁ Why do they choose those alternatives?
- ⦁ How do they buy the alternatives?
- ⦁ Who ARE the competitors?
- ⦁ What makes the competitors' alternative more attractive?
- ⦁ What are the competitors doing to serve the non-customer?
These questions frame the search for the right data.
Where is the data? Ask the right questions first, and the questions will lead you to the data.
What do we do with the data?
Modeling is SO important. Modeling is the process that converts data into information. Data is not information. Data is just data. Data becomes information when it helps to answer the questions you are asking.
Analysis and modeling processes convert data into information. This is where the most value occurs, when you identify the data that does not answer the questions you are asking. Modeling exposes the worthless data, the data that doesn’t fit … the data of coincidence.
We can waste so much time, effort, and money working with the wrong data. That waste comes from forcing data to fit a model that we think defines our reality. Sometimes the problem is the data. Sometimes the problem is the model.
What is an analysis model? It is a mathematical representation of reality. The model is not reality.
I build models constantly in my work with clients. Over the past two decades, I have constructed over 2,000 different models. Some very simple, and some very complex. All that work has taught me humility about the predictive accuracy of the models. It boils down to three key lessons that are on my office wall:
- ⦁ The model is only as accurate as your assumptions.
- ⦁ Too many assumptions spoil the results.
- ⦁ No matter how careful you are, you will assume wrong. It will become most obvious and most embarrassing if you don’t show the model to someone else.
Models are nothing but a HUGE collection of assumptions. In fact, most Manufacturing Resource Planning systems (MRP), Enterprise Resource Planning systems (ERP), Warehouse Management Systems (WMS), and Transportation Management Systems start with nothing more than massive assumptions that metamorphose through after-the-fact status updates. These systems give us the illusion of control and information, but only in the sense that our control is after something goes wrong based on the slimmest of information.
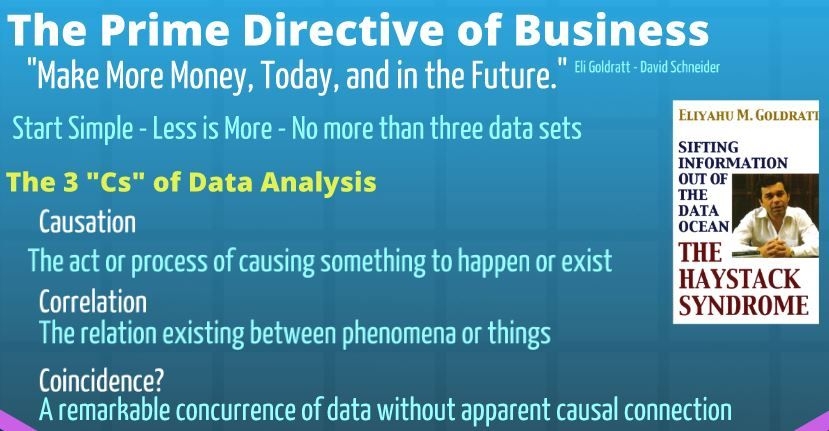
As we develop our big data analysis models, we must remind ourselves of the three rules of assumptions. To help you wrap your thinking around the issue, I recommend a rare book that addresses the logic of converting data to information. Published in 1990, Eli Gordratt’s "The Haystack Syndrome" focuses on the trouble with data, how data is not information, how data is not knowledge, and data is not wisdom. Goldratt wrote the book for manufacturing managers struggling with the technological hype of that era — Manufacturing Resource Planning Systems (MRP). The first part of the book illustrates people’s misconceptions about data and information. At a minimum, all big data teams should read Part 1.
Eli not only separates data from information, he proposes the design of an information system. All companies have data systems; few have real information systems. Information systems pull data from different data systems, converting the data into structures supporting the kind of analysis that yields insight and understanding. That is the structure behind the research part of big data – pulling data from many sources for analysis and insight.
Goldratt’s "Haystack Syndrome" exposes a fundamental truth of analysis, what I call the Three Cs of Data Analysis. We are searching for causation, the rare occurrence of a triggering event or mood. Like the purple squirrel at the top of this article, causation is something special. What we usually find in our analysis is correlation, i.e., simple coincidence. Correlation is two data sets trending together, but we can’t tell if one data set causes the other data set to occur. Correlation is not causation; just because two data sets trend does not mean that they are connected. One may cause the other, or it may not. There could be another factor that we don’t see causing the data correlation.
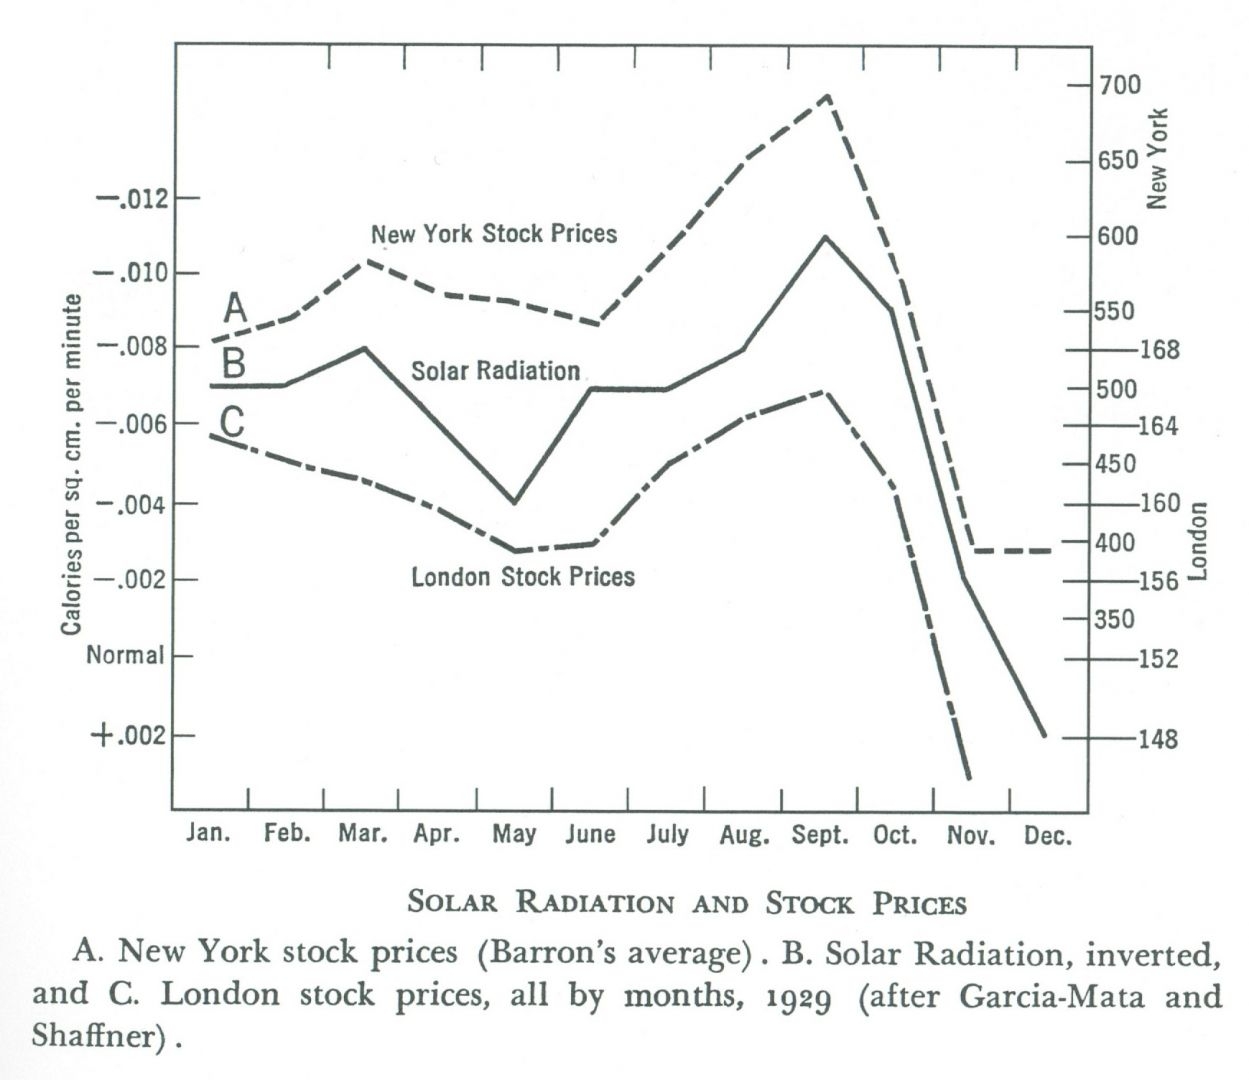
A correlation between data sets can be a mere coincidence. The data sets are indicators of two different, independent causal factors that just happen to trend together. The chart above is an example of three sets of data that show a coincidental correlation. The curves may fit, but why? We should expect world stock market indexes like London and New York to correlate. However, that solar radiation just happens to fit the same pattern is a mere coincidence. Or is it? The note indicates that the solar radiation data is inverted, and that flipping the trend line over makes it fit the pattern. The analyst had to manipulate the data to fit his hypothesis.
Data analysis models fail because of correlation or coincidence assumed to be causal. If the assumption is wrong, the information the model produces is wrong. After a large expenditure of time, energy, and cash on research, there is pressure to present results. Sometimes researchers feel the need to force the data to fit the expected output. While that behavior is sometimes easy to spot, like in the chart above, there are other times, like in the case of climategate, when the manipulation undermines the effort and the mission.
Big data analysis teams must be vigilant for the illusions of causation.
Articles in This Series

Call Us! 877-674-7495 info@dksco1.com