
Sailing on a Sea of Data
There are many ways a company can use data. The miniaturization of electronics and the continued widespread use of wireless data communications allows companies to collect an incredible amount of data. Not only can you collect data at the smallest levels, but you can also collect it from a huge population of sources.
The trucking industry is embracing this technology. In the past 10 years, satellite communications and the falling cost of computers has made the impossible possible. It's not the collection of data that has become easier, but it has become much easier for us to consolidate and analyze the data. The true revolution is in the analysis.
In the past, we could capture the data, but did not know what to do with it.
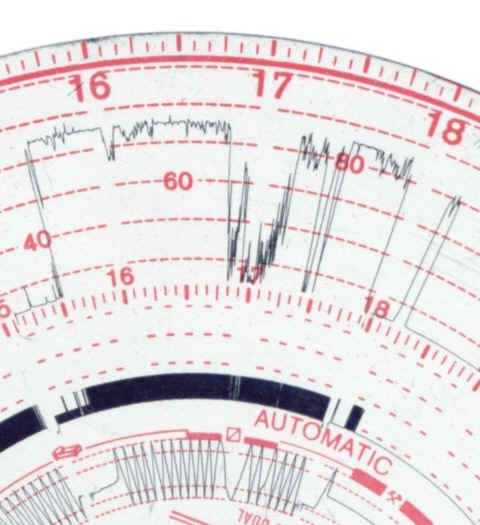
It was possible, 35 years ago, to collect data about the operation of a truck. Tach-o-graphs date back to the 1960s, and they were used to track the tachometer and speedometer readings of a truck, capturing the data on a round disk of graph paper. But once captured on that paper disc, the data could not be transferred or consolidated with other performance data for the same driver, truck, or fleet. Analysis had to be done manually, one disc at a time, each disc reviewed by a human being. The analyst had to look at a series of discs, manually measure them, and then calculate the data from the squiggly line on the round graph paper. The real value of the data never materialized.
In the mid-1980s, Rockwell International introduced the Tripmaster system, replacing the old Tach-o-graph with a computerized black box that recorded the data. Each day when the driver turned in his truck, he hooked up the data tether and a central computer would slurp up the data from the onboard system. Now a fleet manager could download the data from the trip master system and perform elementary analysis. The process depended on the skills of the fleet manager. While the personal computers of the time, the IBM – XT or AT, had the necessary computing power, the average fleet manager did not possess the skills or training to really tease value out of the data.
The next major step forward arrived with the widespread use of cellular telephone communications. In the late 1990s, the major truckload carriers began to install QUALCOMM data terminals. Using a combination of cellular technology and GPS satellite technology, carriers could now track the location of their trucks. More importantly, they could communicate with their drivers in a format much closer to real time. The same old data about truck engine speed and other mechanical parameters, now called telematics, could be collected and transmitted to a central computer. The additional layers of data about the physical location of the truck and the communications between the driver and the dispatcher added even more value to the system.
The state of the art on the electronics and collection side of the equation continues to advance. The cost of the units and their ability to collect the telematics has improved more slowly. The introduction of Bluetooth technology simplifies the process of connecting a cellular phone or mobile computer to the sensors wired directly to the truck.
The challenge no longer is how to collect the data. The real challenge is how to analyze the data.
The general business press has been highlighting some of the data analysis activities in the trucking industry. At a FMCSA hours-of-service listening session, a representative from Schneider National spoke about how they could model the cost impact of the proposed HOS rule changes on their fleet operations. In essence, Schneider is able to take an ocean of data about customer loads and the parameters of those loads, and then model what the fleet movements would have been with the rule change.
Back in 2003, Schneider National decided to invest in a tactical planning simulator. They became interested in the logistics simulations created by Prof. Warren Powell at Princeton. In the 1980s, Powell's lab had changed the less-than-truckload industry segment by developing tools that would map out more efficient route plans and terminal locations. Yellow Freight, Ryder, and some other trucking companies embraced Powell’s software, which enabled them to survive the recession of the late 1980s and the impacts of deregulation of the LTL industry. The LTL companies that survived the regulation were the same companies that embraced Powell's work.
Schneider was mostly interested in Powell's work in the field of approximate dynamic programming. This field studies ways to make decisions where there is a great deal of uncertainty. To model a dispatcher’s decision-making process, a carrier needs to take into account unobvious and sometimes random variables that will affect the efficiency of thousands of drivers.
To make this kind of modeling work, you have to change the nature of the data to match the structure of the mathematical formulas. An easier way to think about this is to imagine that your tool is a screwdriver. Even if your problems are nails or bolts, you have to figure out a way to translate them into screws so that you can apply the tool.
Schneider and Princeton engineers invested over two years of effort and many millions of dollars developing the simulator. Launched in 2005, the simulator basically pretends that it assigns freight and gathers orders based on scenarios created by the analysts. This allows the company to simulate not just the impact of singular changes, but the impact of many simultaneous changes on their network. They can run the simulation forward and backward to improve their calculations.
In some ways, this form of simulation is really a brute force solving mechanism. Depending on the Law of Large Numbers, the simulation is run forwards and backwards enough times until a high confidence level is achieved. The solutions provided by the simulators will never be perfect, but they don't need to be. And using the simulator allows the company to model the marginal value of different operation decisions. An example would be when a customer wants to restrict dock operations, or if the customer moves a major distribution center. The carrier can then run simulation scenarios to justify rate increases.
Simulation requires an incredible amount of data, so Schneider National’s use of the simulator is just one example of how to sail on a sea of data. Next, we will look at the impact of focusing on the tiniest of details.
Articles in This Series

Call Us! 877-674-7495 info@dksco1.com